Build Your Trading
Build Your Trading has superb risk control
<< Back to FAQ
It is essential that risk control is incorporated into the analysis process.
Build Your Trading provides several layers of risk control, ranging from stop losses associated with all
alerts to loss limiting methods included in the analysis, management and methodology.

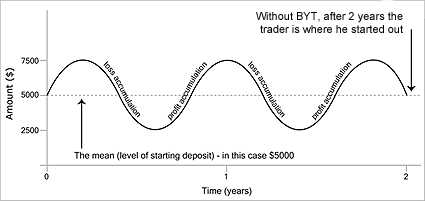
Figure 1
This figure shows how lack of management will result in no progress in funds accumulation over months or years of trading. This chart measures a trader’s ongoing profit and loss accumulation. It is not a depiction of currency price movements.

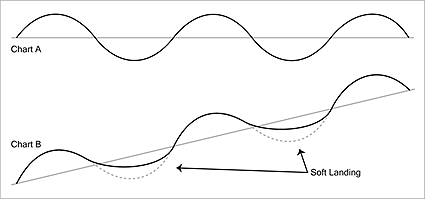
Figure 2
In Chart B the modified declines or “soft landings” cause long term growth. The actual trades in Chart A are exactly the same as in Chart B. Chart A suffers from the same adverse phenomenon shown in Figure 1.
In Figure 2 you will see the effect of the Build Your Trading automatic management. Note how Chart B rises and Chart A has no growth over time. This is because the Build Your Trading automatic management has reduced the severity of the alternate (and inevitable) trading periods where the percentage of losing trades cause account balance decline. The management converts these decline periods to lesser declines or soft landings. This results in the more difficult trading experiences being less significant, protecting the trader for when the cyclical periods of better trading recommence.
It is very common for traders both experienced and inexperienced to approach the markets as if
market analysis is the only discipline to be addressed. This is a huge fallacy and probably one of
the biggest causes of the high number of failed traders in the community. There are significant
numbers of people around who devote much time and effort in trying to discover a way to
eliminate losing trades altogether. Perhaps the worst implication for them is that they reject any
method of analysis which results in a percentage of losing trades. This is an example of assigning
blame for failure on such methods which coupled with management and method are nevertheless
valuable. It is regrettable that well known trading seminars and tuition in many cases merely cover
the area of market analysis without any heed to management or methodology. Because of the
nature of the markets, probably due to the randomness of fundamental price movement causes,
there is no method which can possibly show trend changes successfully all the time.
There will always be a significant percentage of losing trades. These percentages can and usually will wipe
out the benefit of the other profitable trades if a management and loss limiting technique is not
used.
It is not enough to simply look for ideal entries and exits from the market. This is one of the most
common mistakes that traders make. No matter how good your buy and sell signals are, you will
still have substantial draw downs on your trading account funds if there is no account
management. This is because the success of your market analysis will be cyclical. There will be
alternate successful and not so successful periods. We call this your performance cycle.
Account control, growth and management are where the largest returns are in trading. It is rare for
a trader to get rich purely from the analysis of markets. It is through the use of compounding of
results coupled with loss limitation that opportunities are provided in this field. A good trading
management system should build on successes in the same way that compound interest builds
on itself. This is how the Build Your Trading management works.
Most traders are more than acutely aware that there are positive and negative cycles of traders’ success over the months and years and that they alternate. These cycles have a predictive quality which has been harnessed in Build Your Trading.
A chart diagram of this process looks like the chart in Figure 1. It measures a trader’s ongoing profit and loss accumulation. The average is the straight line through the middle and the opposite extremes are the peaks at the top and the troughs at the bottom. Notice how the two extremes always alternate with each other after the line of the chart passes through the average as it makes its way through the average.